 The Obama administration has filed a petition with the Federal Communications Commission asking that all wireless carriers be required to unlock all mobile devices, reports The Washington Post. The move comes several months after The White House backed a "We the People" petition that successfully garnered more than 100,000 signatures calling for cell phone unlocking to be made legal.
The "We the People" petition was started following an October ruling by the Library of Congress' Copyright Office that ended an exemption within the Digital Millennium Copyright Act that formerly allowed cell phone unlocking. It became illegal for U.S. mobile phone users to unlock newly purchased cell phones without express permission from their cell phone carriers on January 26, 2013.
According to Tuesday's petition from The White House's National Telecommunications and Information Administration, permitting unlocked devices, including both smartphones and tablets, would increase both competition and consumer choice.
"Americans should be able to use their mobile devices on whatever networks they choose and have their devices unlocked without hassle," said Lawrence Strickling, assistant secretary of the NTIA.
The FCC reportedly began investigating whether or not the cell phone unlocking ban results in harmful effects for consumers in March, though no news has surfaced on the issue since then.
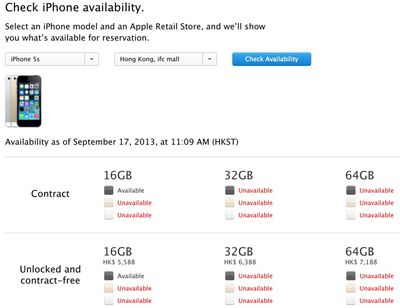
At this time, it remains illegal for individuals to unlock cell phones purchased after January 26, 2013 in the United States. Carriers are still permitted to unlock devices, however, and unlocked devices can also be purchased at unsubsidized prices from a number of carriers.





 Apple has updated