A new trend study published by Nielsen this week looks into the top smartphone apps of 2016, as well as the operating systems that the apps were downloaded on. This year within the United States, Facebook won the top spot with more than 146 million average unique users each month.
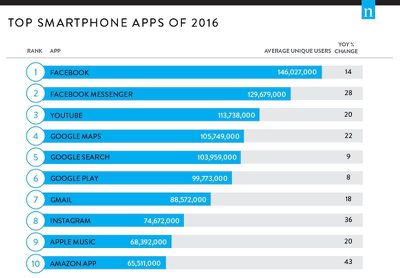
The social network company also dominated the second spot with Facebook Messenger at 129 million unique users per month. Following Facebook's winning of the top spots, Google holds most of the remaining spots with YouTube (113 million), Google Maps (105 million), Google Search (103 million), Google Play (99 million), and Gmail (88 million). Another Facebook-owned app in the 8th spot, Instagram (74 million), bookends the Google apps.
For Apple, the only app that appears on Nielsen's chart is Apple Music, with just over 68 million unique users each month, a growth of 20 percent from 2015. Earlier in December, it was reported that Apple's music streaming service had officially surpassed the 20 million subscriber mark. Amazon's popular shopping app rounds out the list in the 10th spot with 65 million monthly users.
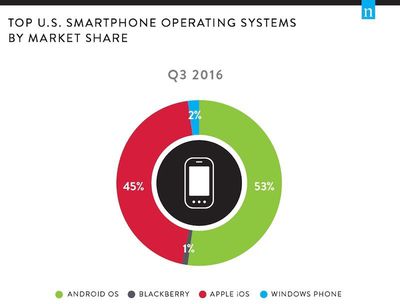
In the third quarter of 2016, the apps were opened on average 53 percent of the time on an Android operating system and 45 percent on iOS, according to Nielsen's data of around 9,000 panelists. Windows Phone and BlackBerry accounted for a minimal portion of the statistics at 2 percent and 1 percent, respectively.











Top Rated Comments
Also, I become a little more shocked every year that Blackberry is still around.
I use Google services because half of my phone use is on Android and it's the best option for Android, but I lock down my privacy settings as best I can. They do give you tools to do that but it requires constant vigilance to maintain them. I can certainly understand why someone would avoid Google.
METHODOLOGY
Nielsen’s Electronic Mobile Measurement is installed with permission on panelist smartphones (approximately 9,000 panelists ages 18+ with Android and iOS handsets). The panelists are recruited online in English and include Hispanic, African-American, Asian-American, Native American and Alaskan Native and other mixed racial background consumer representation.
This method provides a holistic view of all activity on a smartphone as the behavior is being tracked without interruption. Data is based on Nielsen’s monthly survey of 30,000-plus mobile subscribers aged 13 and up in the U.S. Mobile owners are asked to identify their primary mobile handset by manufacturer and model, which are weighted to be demographically representative of mobile subscribers in the U.S. Smartphone penetration reflects all models with a high-level operating system (including Apple iOS, Android, Windows and BlackBerry).