Research firm IDC today published its tablet shipments estimates for the first calendar quarter of 2014, with Apple holding onto its lead in tablet market share. According to IDC's Worldwide Quarterly Tablet Tracker, the iPad accounts for approximately one third of all global tablets shipped in the first three months of 2014.

On a vendor basis, Apple remains the number one manufacturer, but its dominance is starting to slip. iPad shipments declined both quarterly and yearly, causing Apple to lose some ground to rival Samsung, which saw increases in both units shipped and market share.
Apple maintained its lead in the worldwide tablet plus 2-in-1 market, shipping 16.4 million units. That's down from 26.0 million units in the previous quarter and well below its total of 19.5 million units in the first quarter of 2013. Despite the contraction, the company saw its share of the market slip only modestly to 32.5%, down from the previous quarter's share of 33.2%. Samsung once again grew its worldwide share, increasing from 17.2% last quarter to 22.3% this quarter. Samsung continues to work aggressively with carriers to drive tablet shipments through attractively priced smartphone bundles. Rounding out the top five were ASUS (5%), Lenovo (4.1%), and Amazon (1.9%).
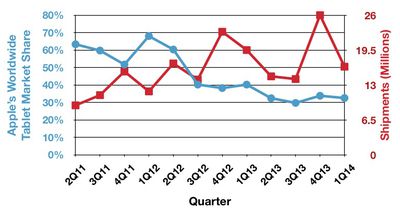
On a platform basis, Android is the leader with a two-thirds share of the market, followed by iOS. Windows market share remains small, but is growing due to popularity of inexpensive, hybrid notebook tablets like the ASUS Transformer T100.
When analyzing these numbers, it is important to note that IDC tracks shipments instead of sales, making it impossible to know how many shipped devices were actually purchased by consumers and how many remain on retail shelves. IDC's figures also are estimates, as most companies do not release their exact tablet shipment data. Research firms like IDC must rely on supply chain data and calculations from information that is made public by manufacturers to build their estimates.














Top Rated Comments
blackcrayon is correct.
"Market share" is simply the percentage of sales in a market over a period of time.
Don't confuse that with "Installed Base" which is the number of units actually in use today.
Those are both industry-standard terms... and they both are used to measure different things.
That graph is far different from reality.
When I go out, I see iPad (in people hands, actually being used) everywhere. I rarely see othe tablet at all. The only place I see so many other tablets are on shelves and demo units but that's about it.
Maybe but market share drives investors and shareholders.
But what this is a sign of is the fact that 2-3 years ago the ONLY table was the iPad. So tons of people bought them, including Android and MS users. With the recent (<1yr) release is new Galaxy, Surface, ect those users have actual options within the ecosystem they prefer. So naturally when it comes time to upgrade they are going to go with that OS tablet style.
This makes sense and hopefully Apple doesn't get to concerned becuase it's natural.
Same thing happened with the iPhone.
But this data still impressive for Apple to be number one knowing lots of competition in the tablet market.